In my first semester in engineering school in the mid-1970s I, along with a cadre of incoming prospective engineering students, took a course that covered a plethora of engineering topics. One portion of that class actually dealt with project management and Gantt and PERT charts. At the time they seemed like topics one had to endure to get through a college course. That was wrong.
I may not be a formal project manager. But I find myself using Gantt charts and the idea behind them from everything from constructing our house to planning dinner parties! Learning to create and use a basic Gantt chart was one of the most valuable take-aways from that engineering introduction.
One of the most beautiful things about a Gantt chart is that it is fundamentally simple enough that it can be understood with only the briefest introductions. What I want to do here is share a brief introduction to Gantt charts so you read them and create basic ones without further work. I will leave it to our project management bloggers to go into aspects like human resource allocation impacts (e.g. how to reassign people to tasks that are behind schedule, if necessary), and other uses for the Gantt chart.
Anatomy of a Sample Chart
Here is a small simple example from Wikimedia.
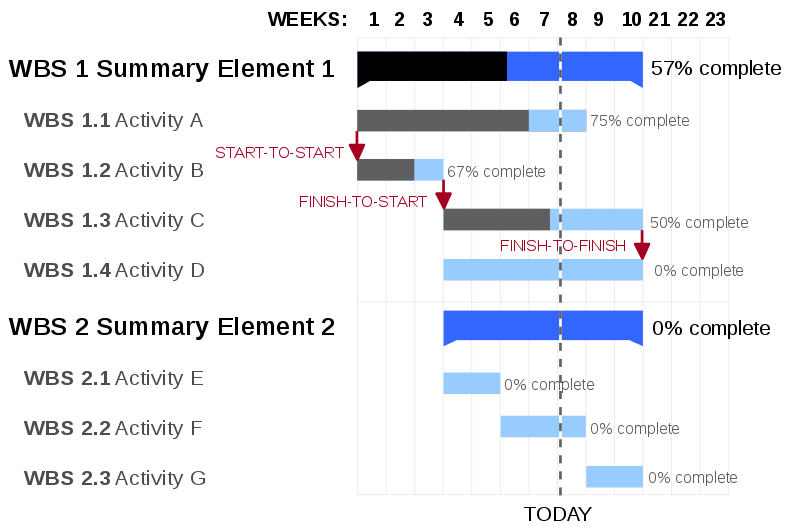
In a real project, the top would probably actually include calendar dates. It may even account for weekends and holidays. The weeks or dates show when tasks should be started and completed for the project to finish on time. We will discuss individual milestones in a future post.
The Summary Elements are the big things to do. In this example, WBS 2 is somewhere around four weeks behind!
The Activities are the component tasks necessary to complete the Summary Element directly above them. The lines show when the task must start based on completion of a prior task (WBS 1.3), the necessity of the task being completed before another can be started (WBS 1.2), or in order for it to be finished at the same time as another (WBS 1.3 and WBS 1.4). Sometimes tasks start at a particular time because of resources being available, and not because of task dependency.
When I plan a dinner party I need a quick visual tool like this so I can chat with friends and not forget anything! These steps could include chopping ingredients, cooking components (e.g. rice or pasta), or kneading bread. If I am making a pasta dish, I'd want to chop the vegetables before cooking them such as WBS 1.2 and 1.3, but I'd want to time the cooking of the pasta itself to be done at the same time as the vegetables like WBS 1.3 and 1.4.
In the case of building the house, these might include surveying the site, digging the footings for the walls, etc.
The chart above shows two important things about task completion: it shows "TODAY" and it shows how far individual tasks have been completed. This example uses black or grey to show completed parts of the tasks. That technically makes this a "progress Gantt chart", but many people ignore that distinction. Also, note that dark blue is used for the summaries. In fact, there is really no standardization for colors.
You can probably also see in this chart that the whole project - including both summary elements - is quite far behind. WBS 1.2 and WBS 2.1 should be done by now and WBS 1.4 and WBS 2.1 should have been started weeks ago!
In a real-life start and completion times can be flexible. The Gantt chart can be used to show that, too. Finally, the chart can be used to help the project manager discover when to start the whole thing so it finishes on time; that is, how long it will take for the whole thing to be completed. We'll look at that in a later post, too.
I hope this brief introduction has helped you see at a glance from a Gantt chart when each task needs to be completed or started for the project to be done on time. We can also use the "TODAY" line and the completion amounts for each activity to see how far ahead or behind the project is.